London Market Group
The OxBow Partners study on how insurance enables green infrastructure, designed and illustrated from the ground up.
The brief
Make a technical subject land.
OxBow Partners had a dense, technical study on how insurance enables green infrastructure across its lifecycle. It needed to read as a considered piece of thinking rather than a slide dump, and the ideas had to land before the detail did.
The directions
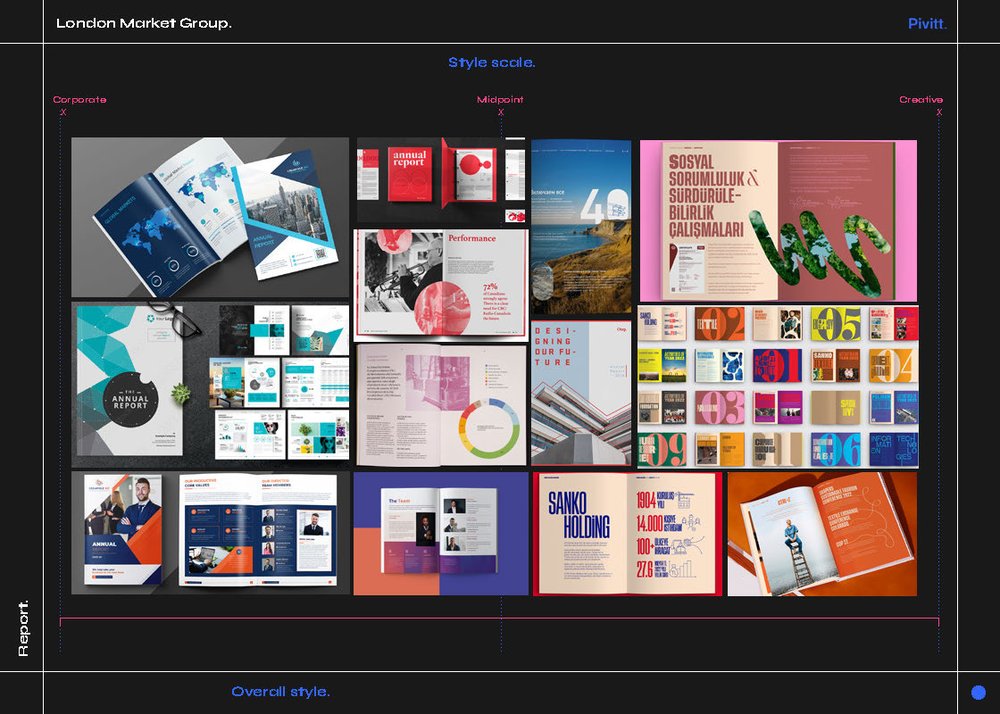
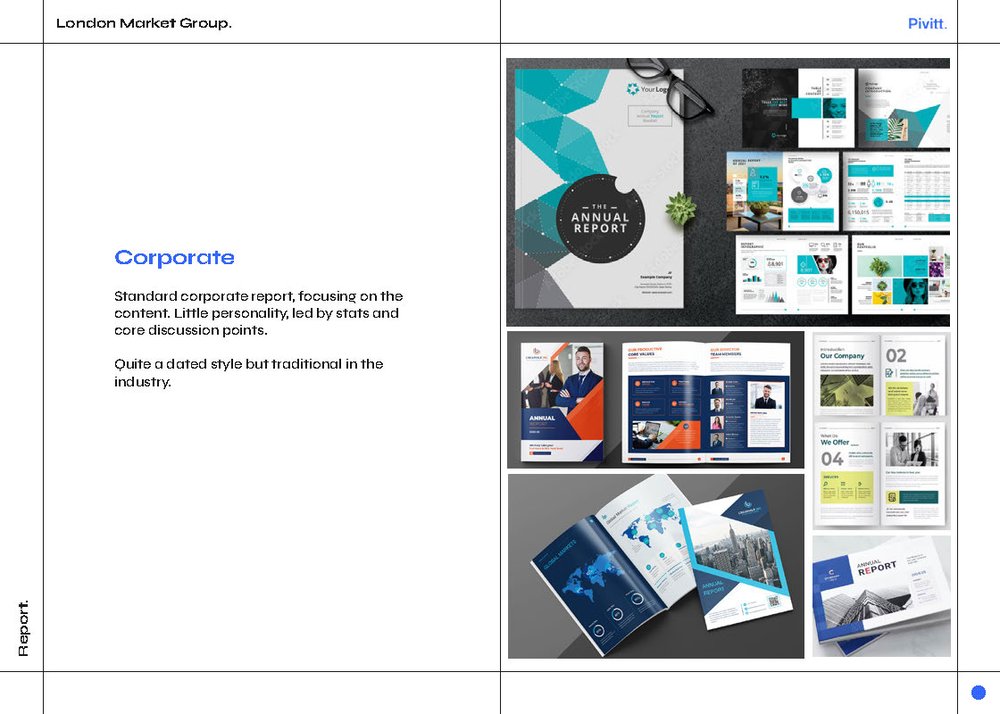
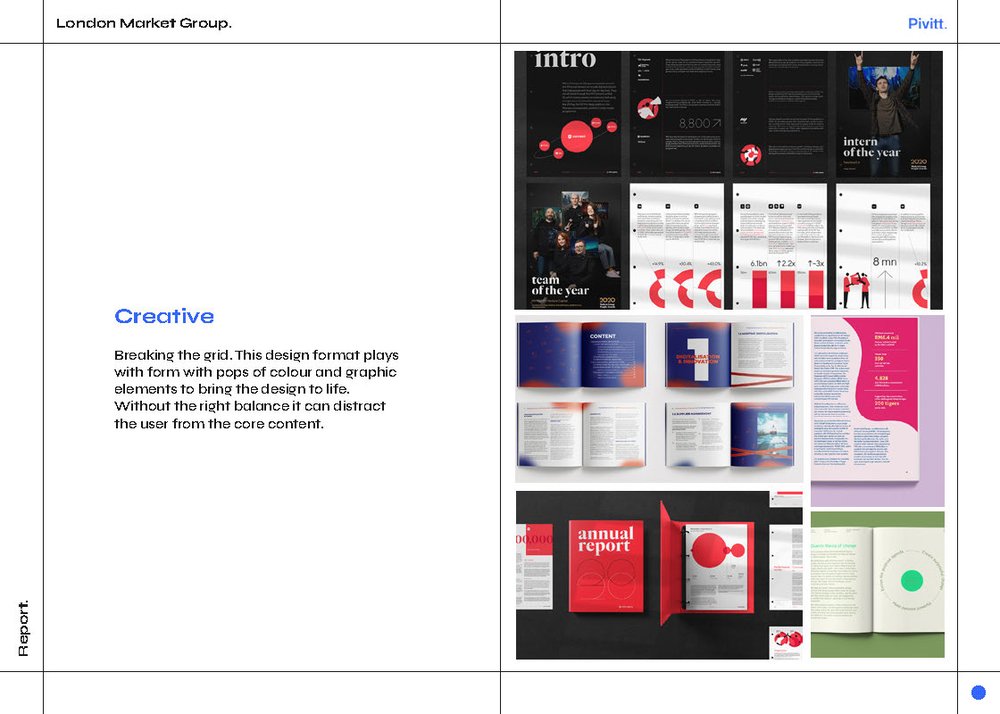
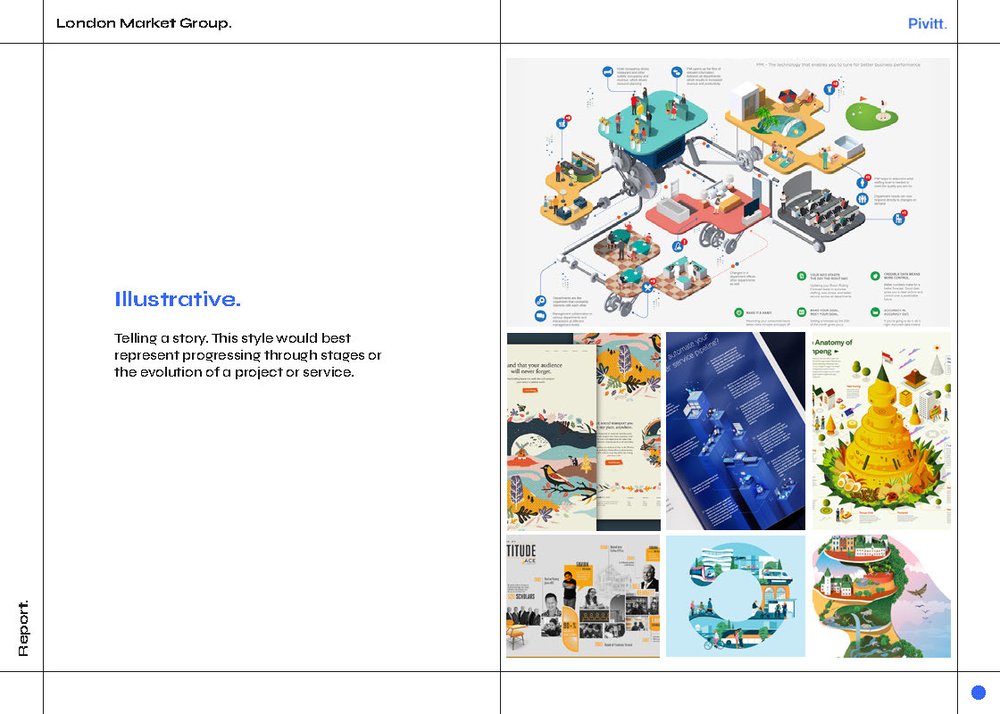
Three routes, explored.
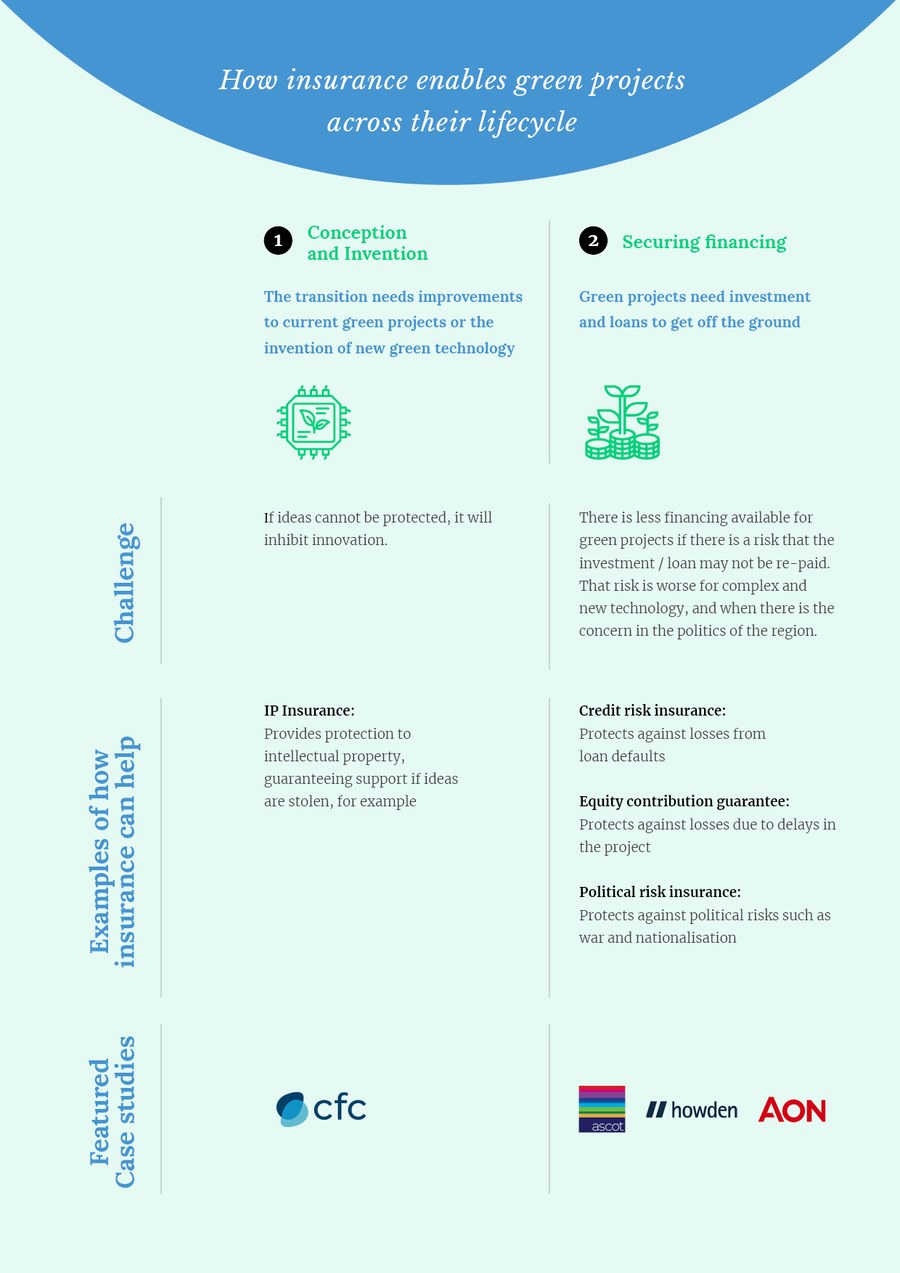
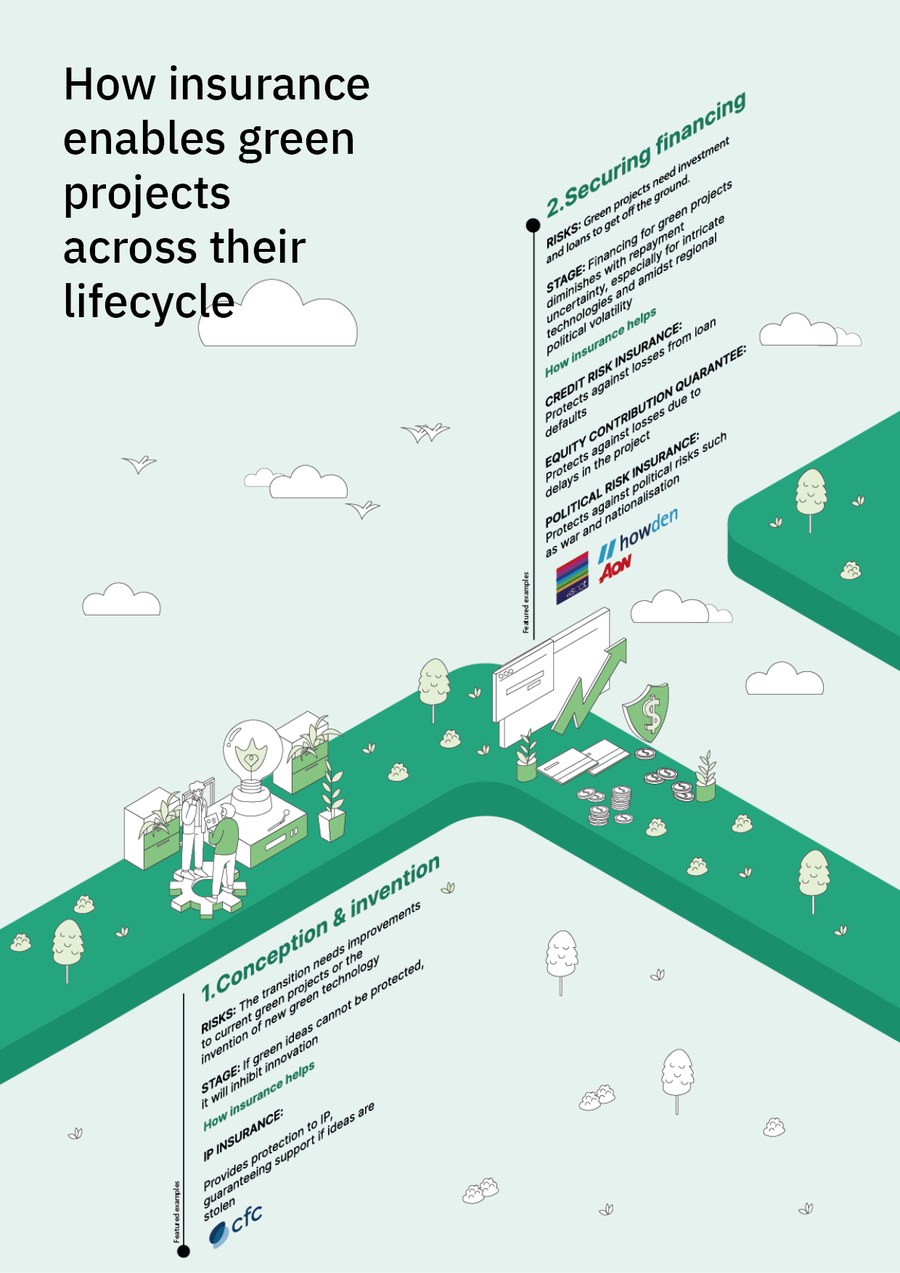
Before a page was set, we explored three distinct routes for the illustration and colour: a photorealistic 3D-rendered set of islands, a blue system, and a flat green isometric world. The isometric won for clarity. It carried the whole lifecycle in one read and held up from a thumbnail to a printed spread.
The exploration
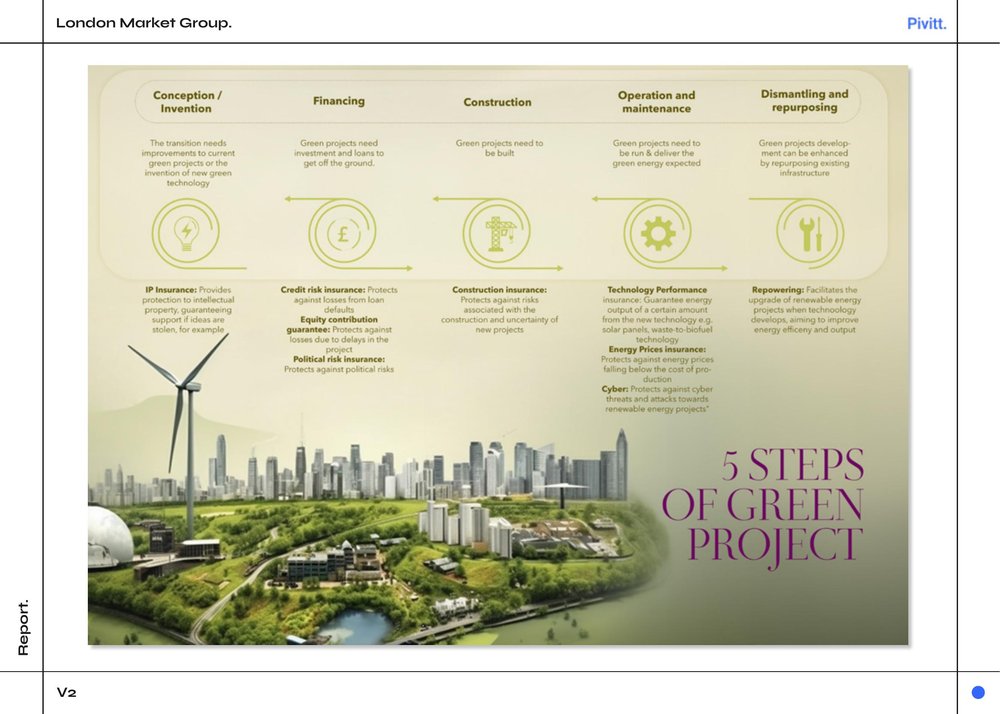
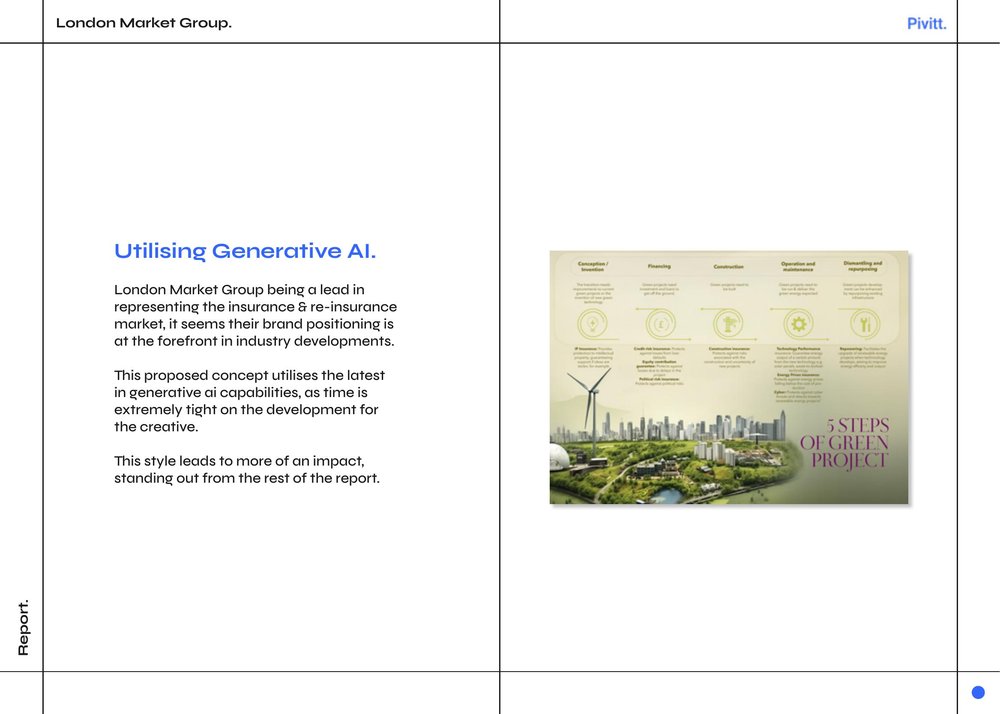
Behind the routes.
The three routes sat on top of a wider exploration: moodboards and composites, a purple colour system, generative-AI experiments and illustration studies, before the green isometric won out.
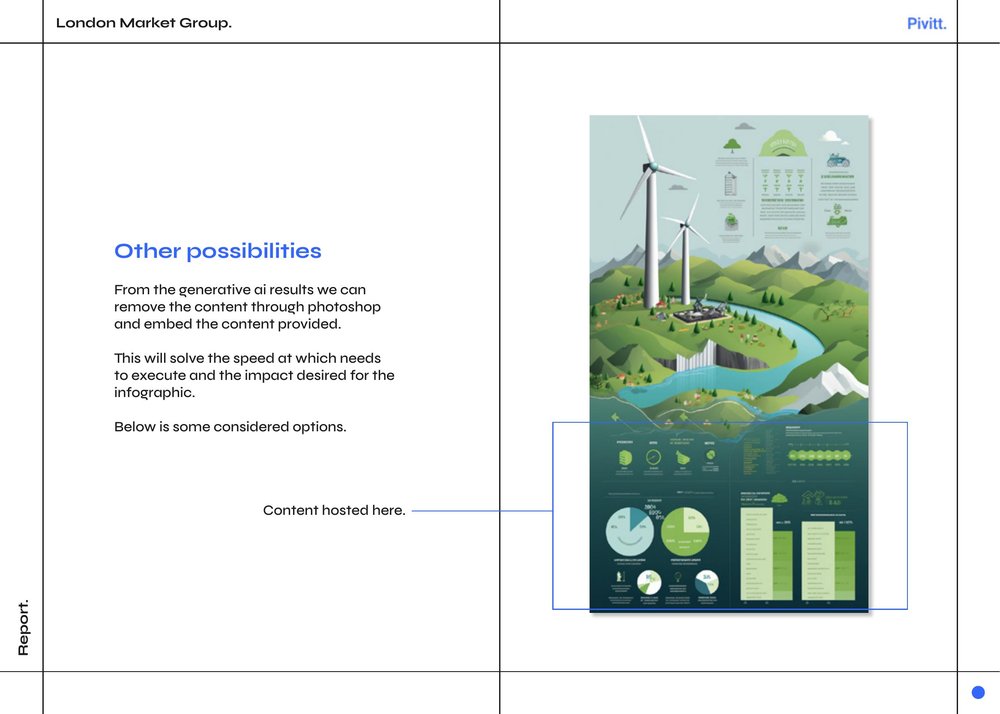
The illustration
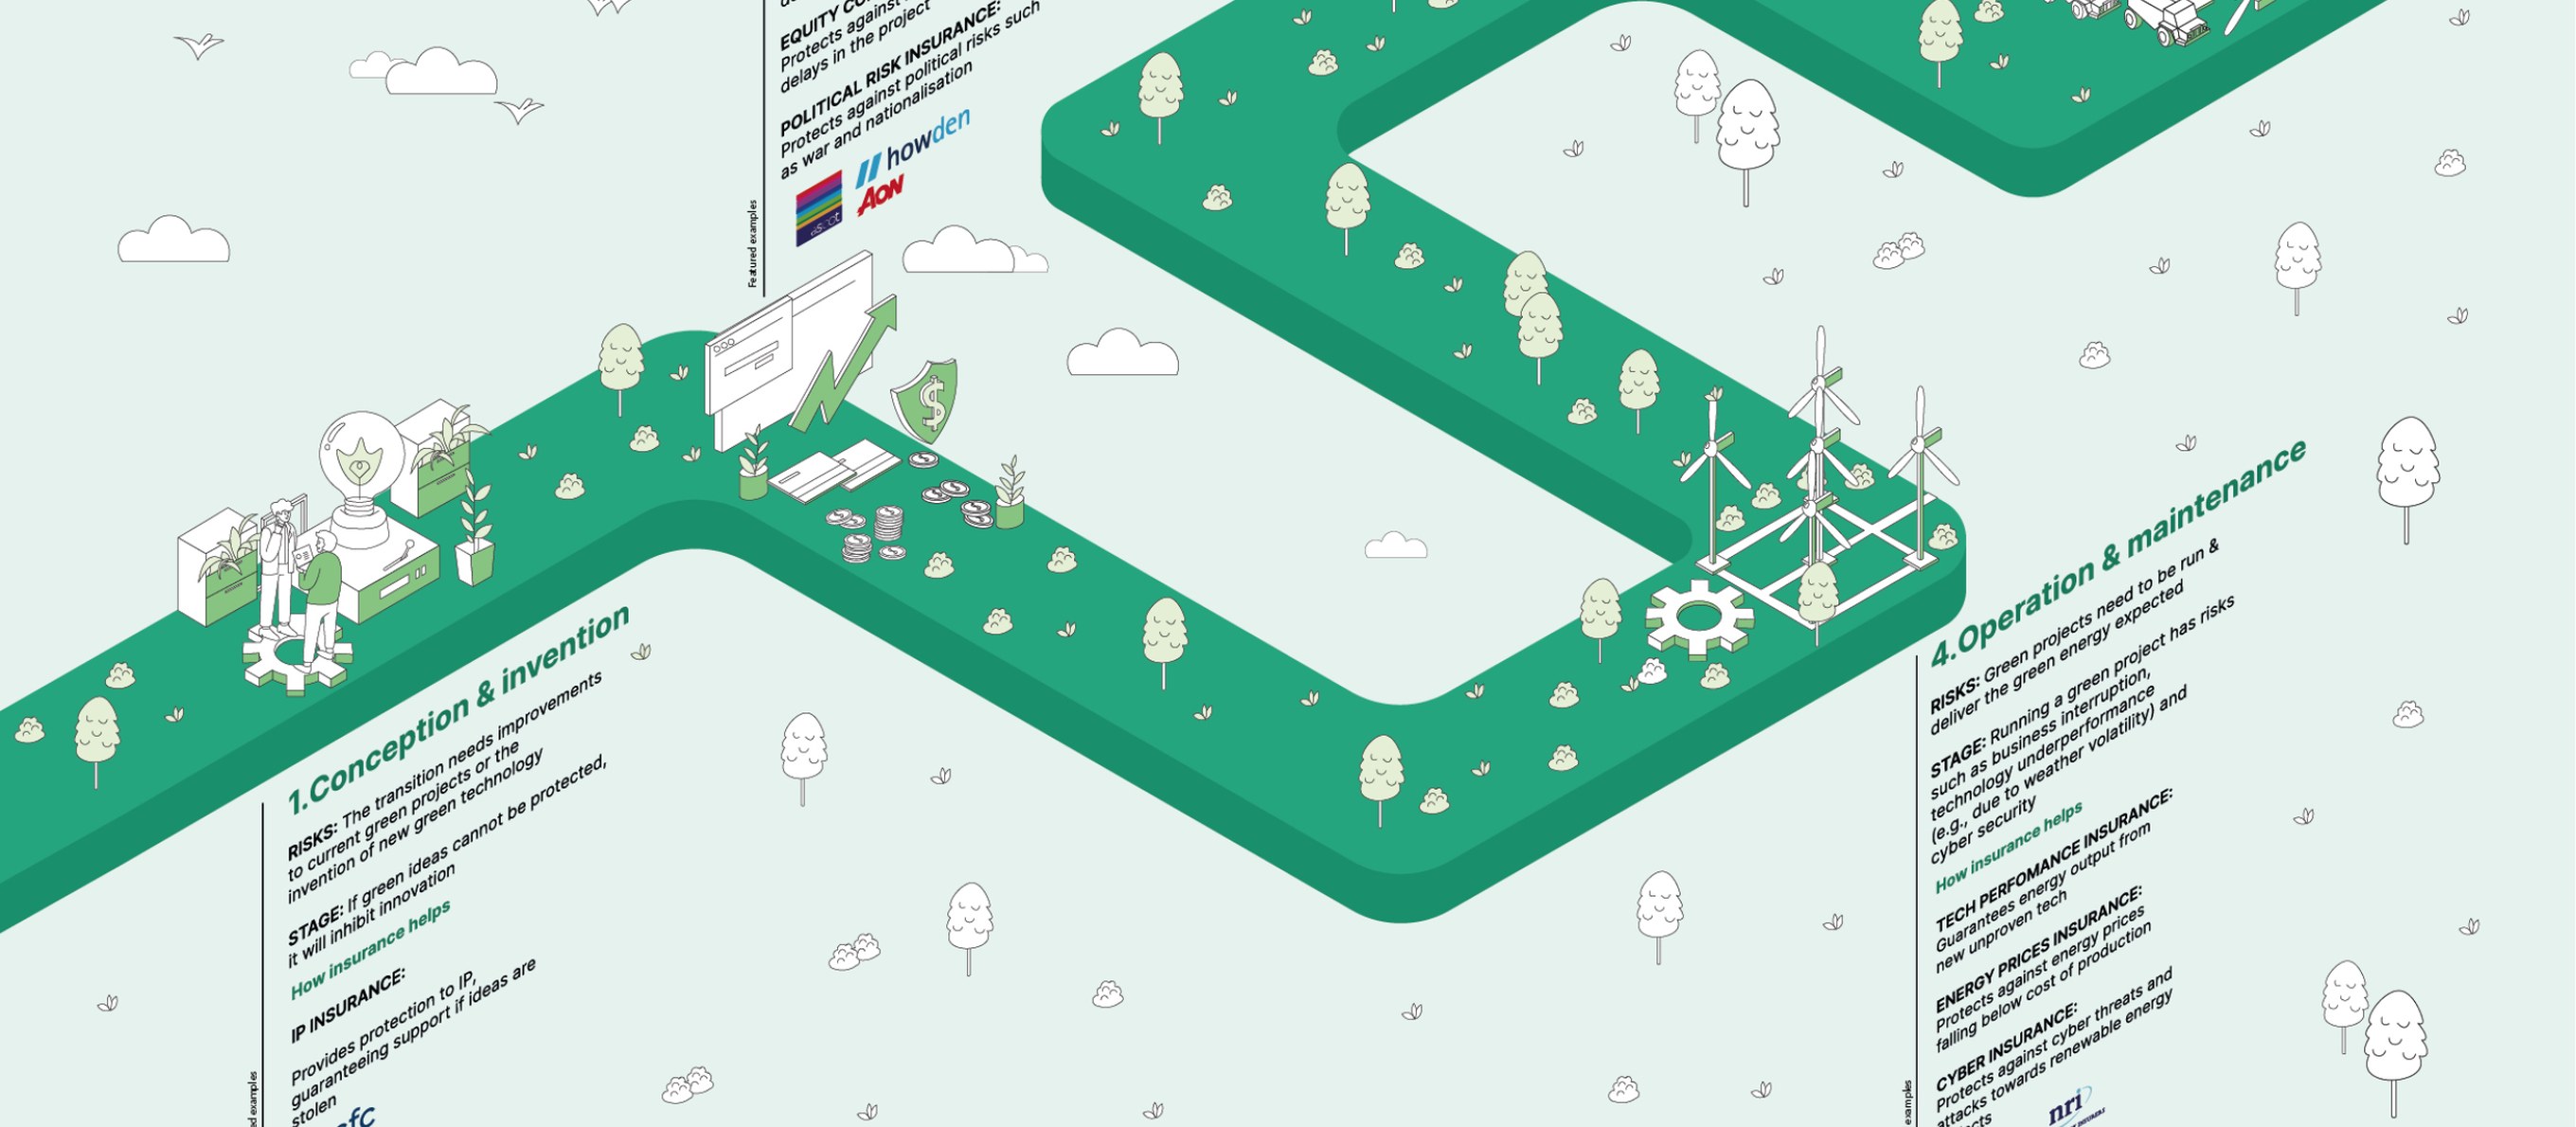
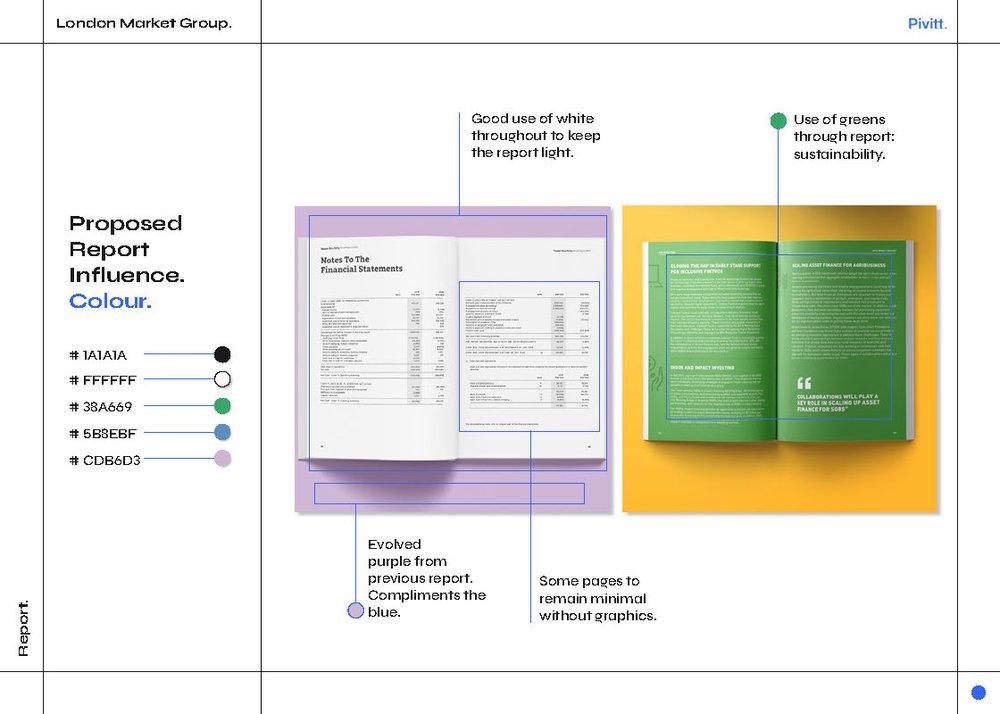
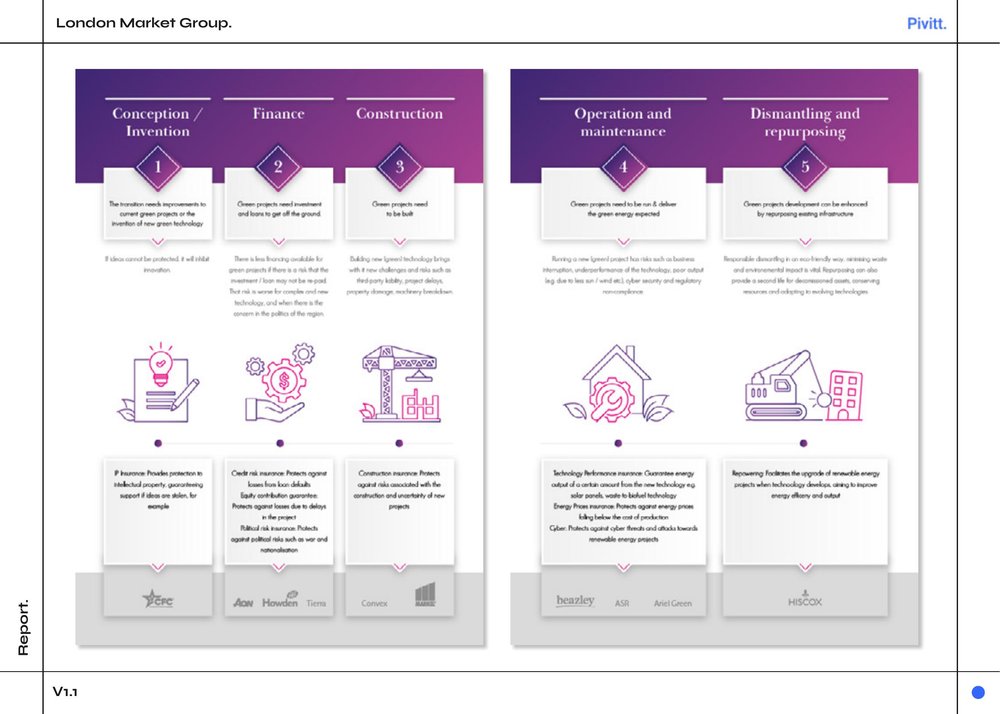
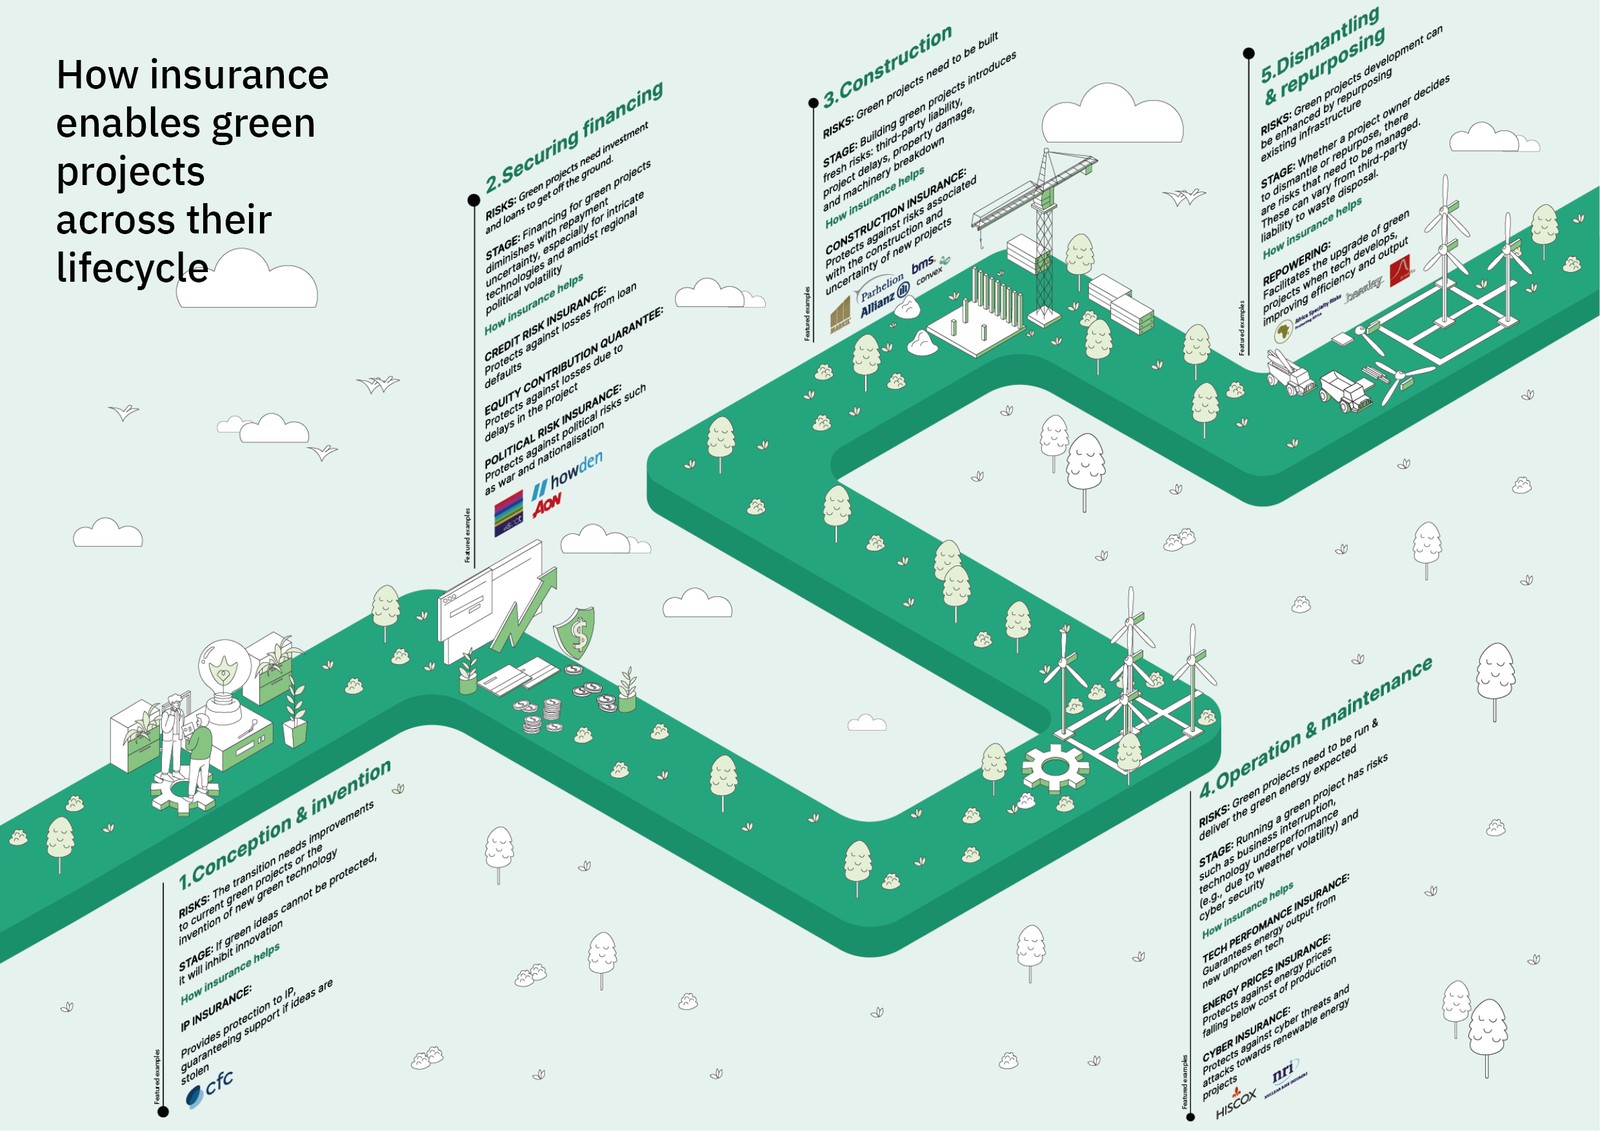
An isometric world for green projects.
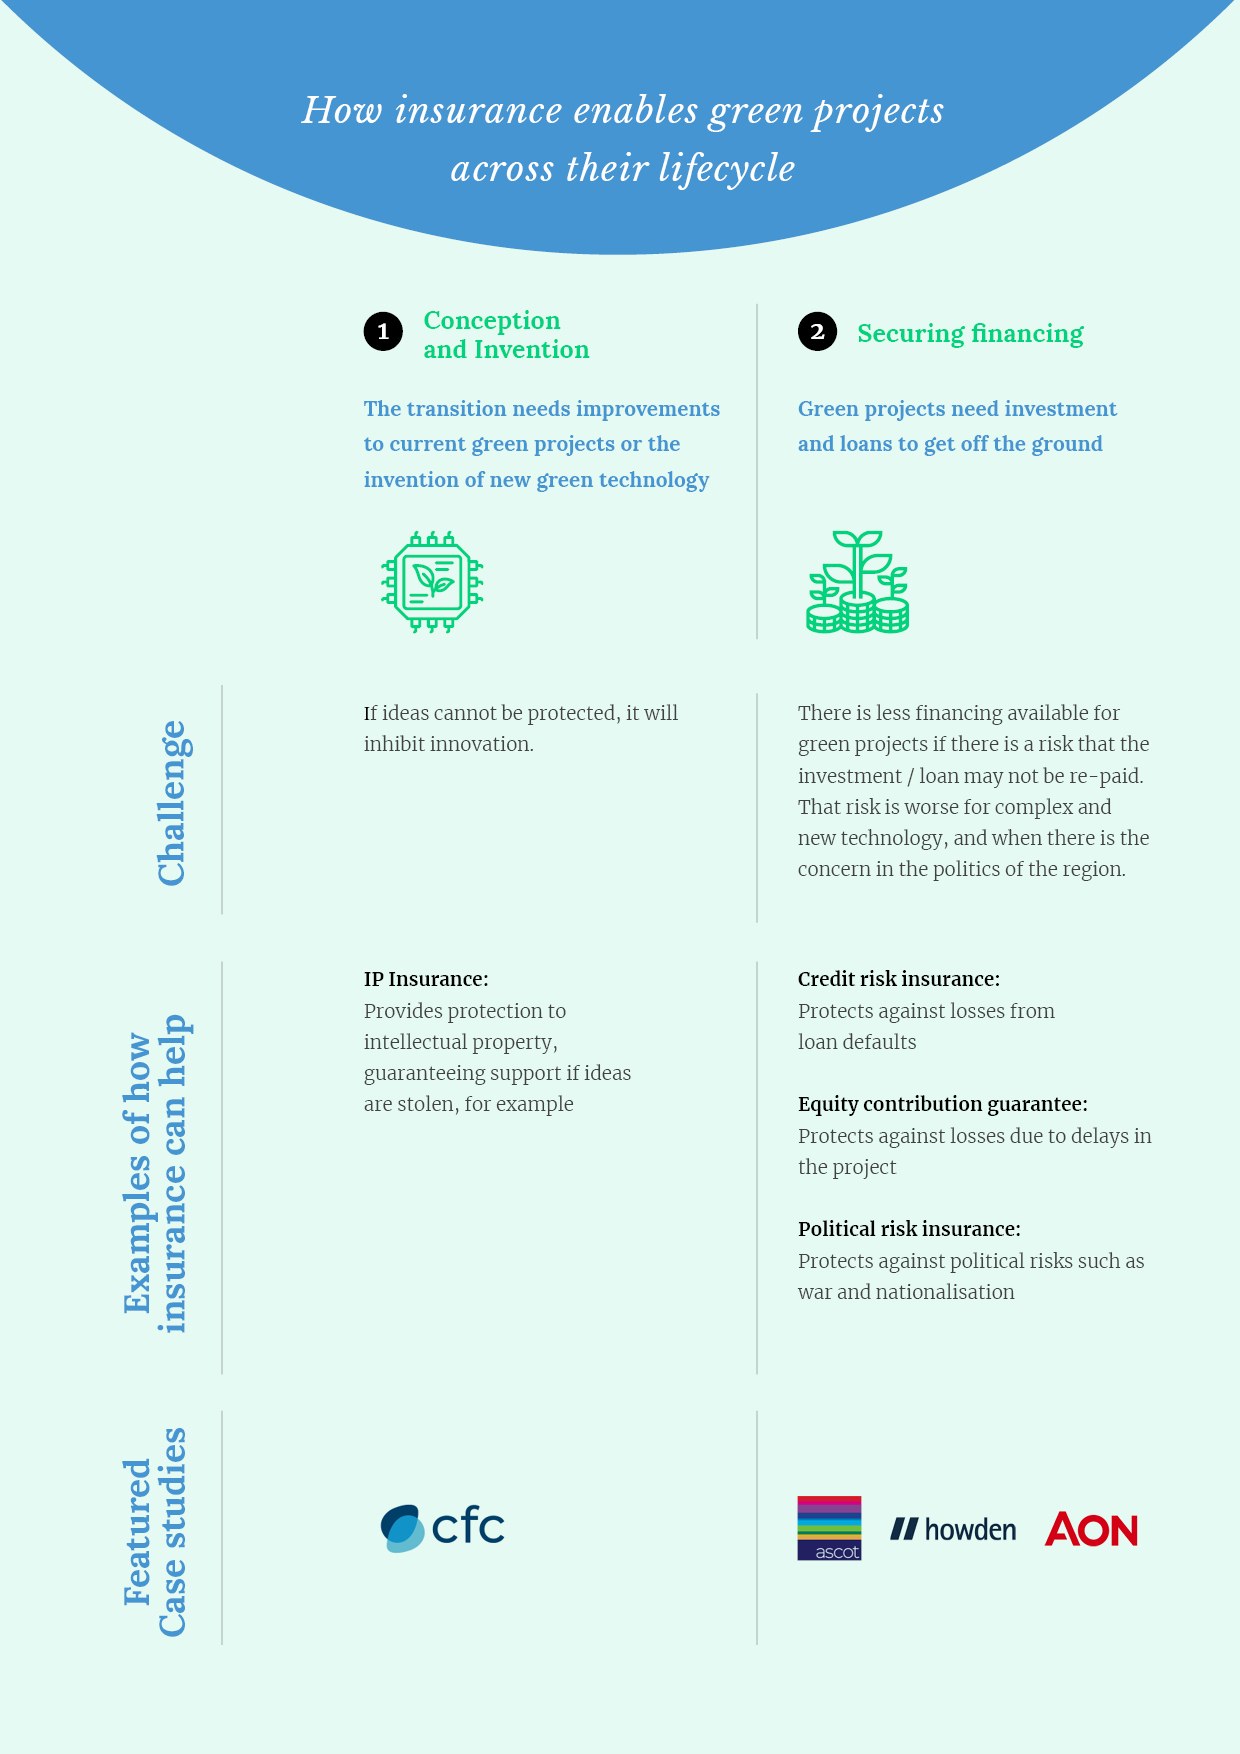
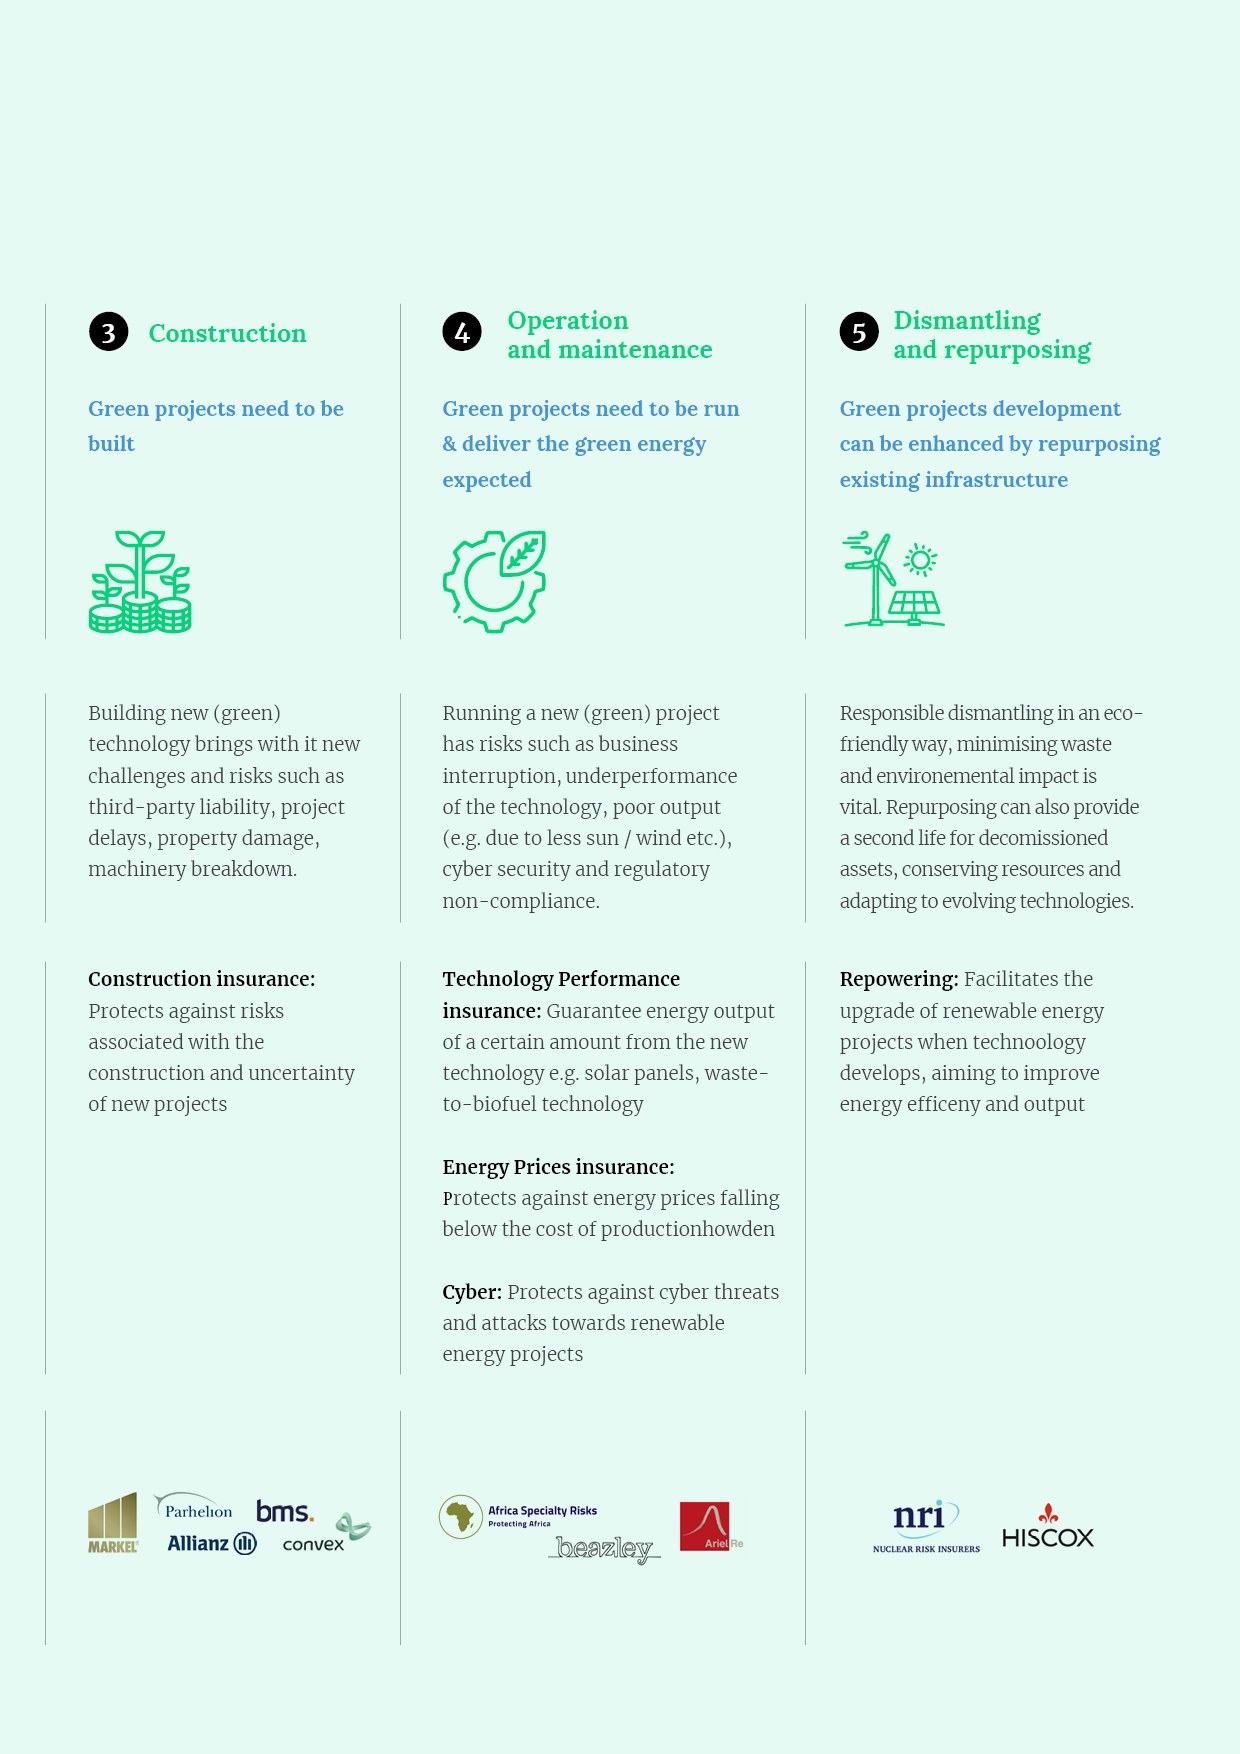
The chosen route built a custom isometric world: green projects shown across their full lifecycle, from conception and financing through construction, operation and repurposing, so a reader sees the idea before reading a word of it.
The system
One system, every page.
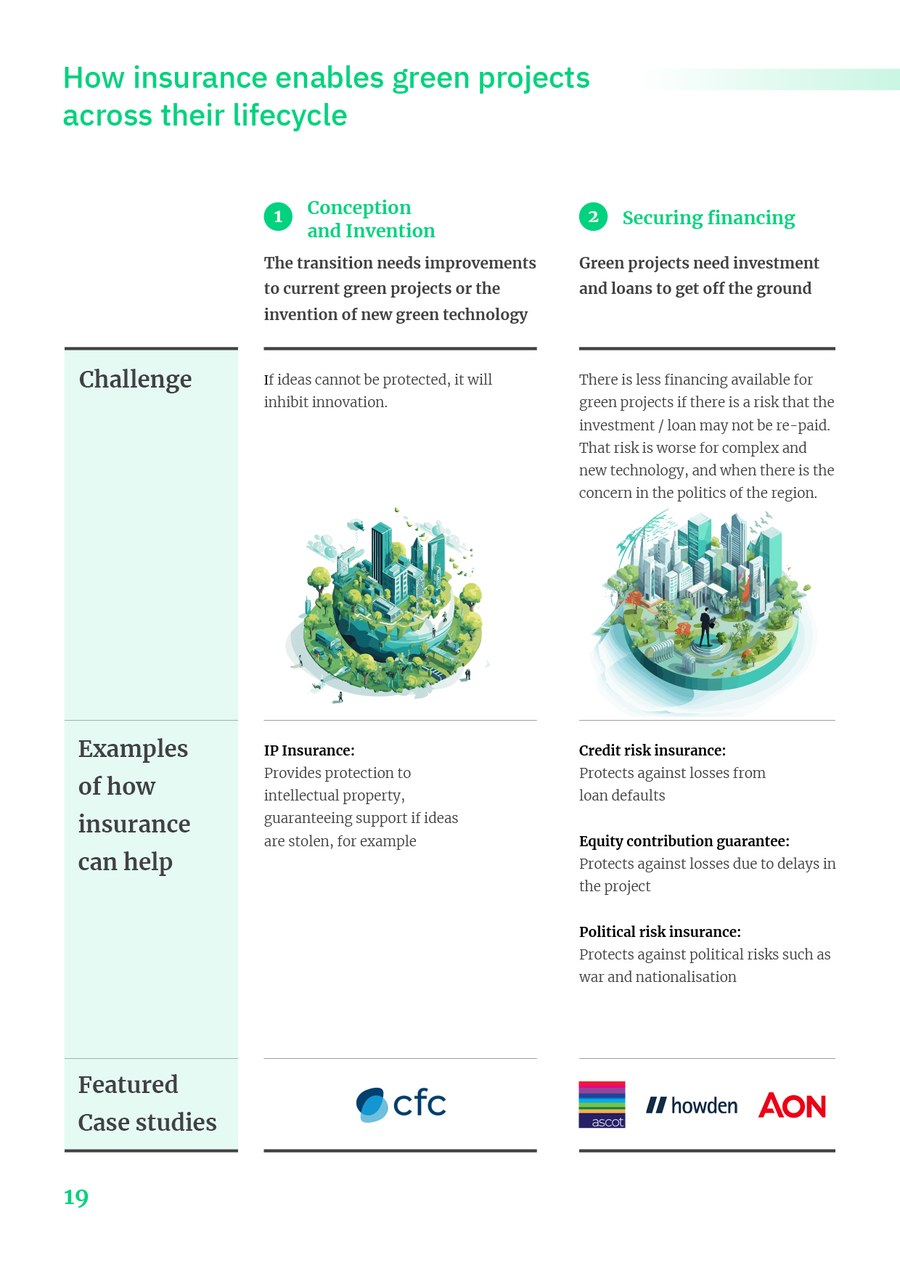
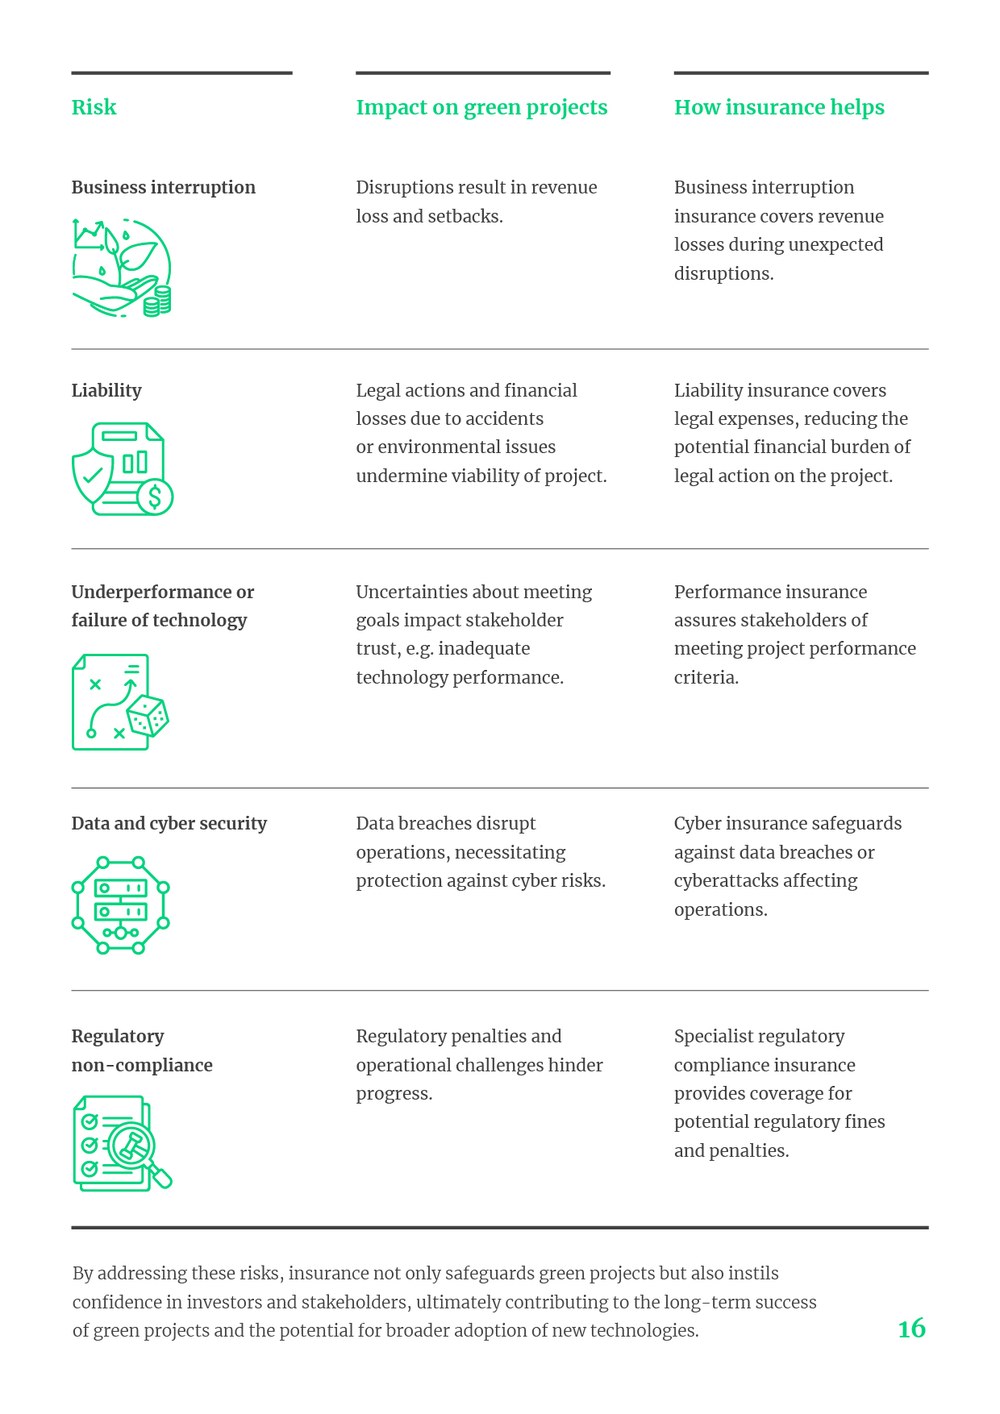
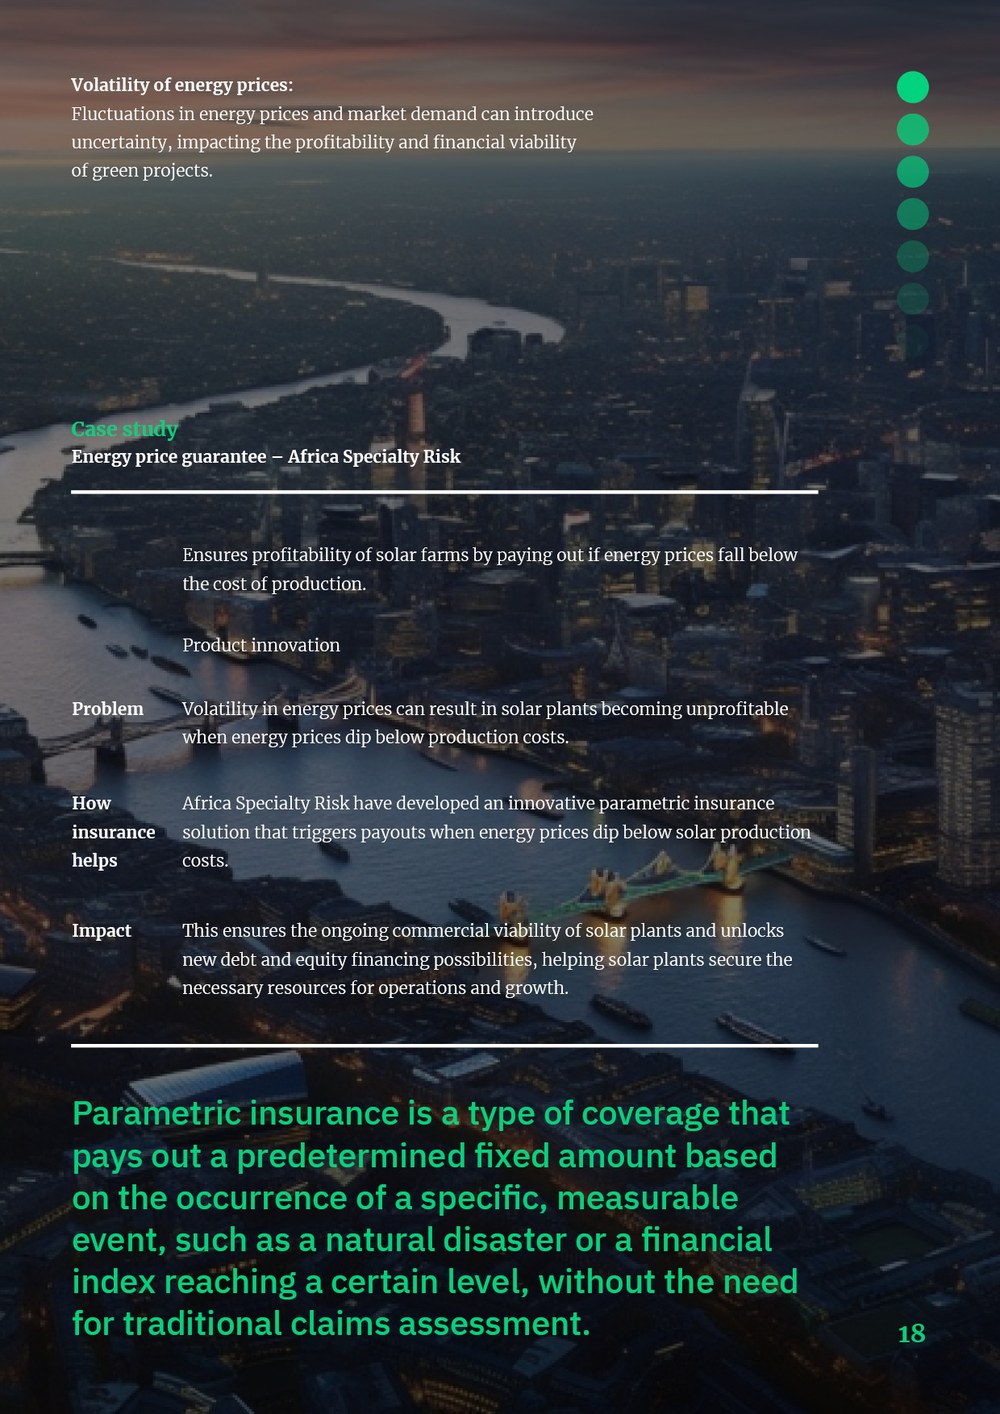
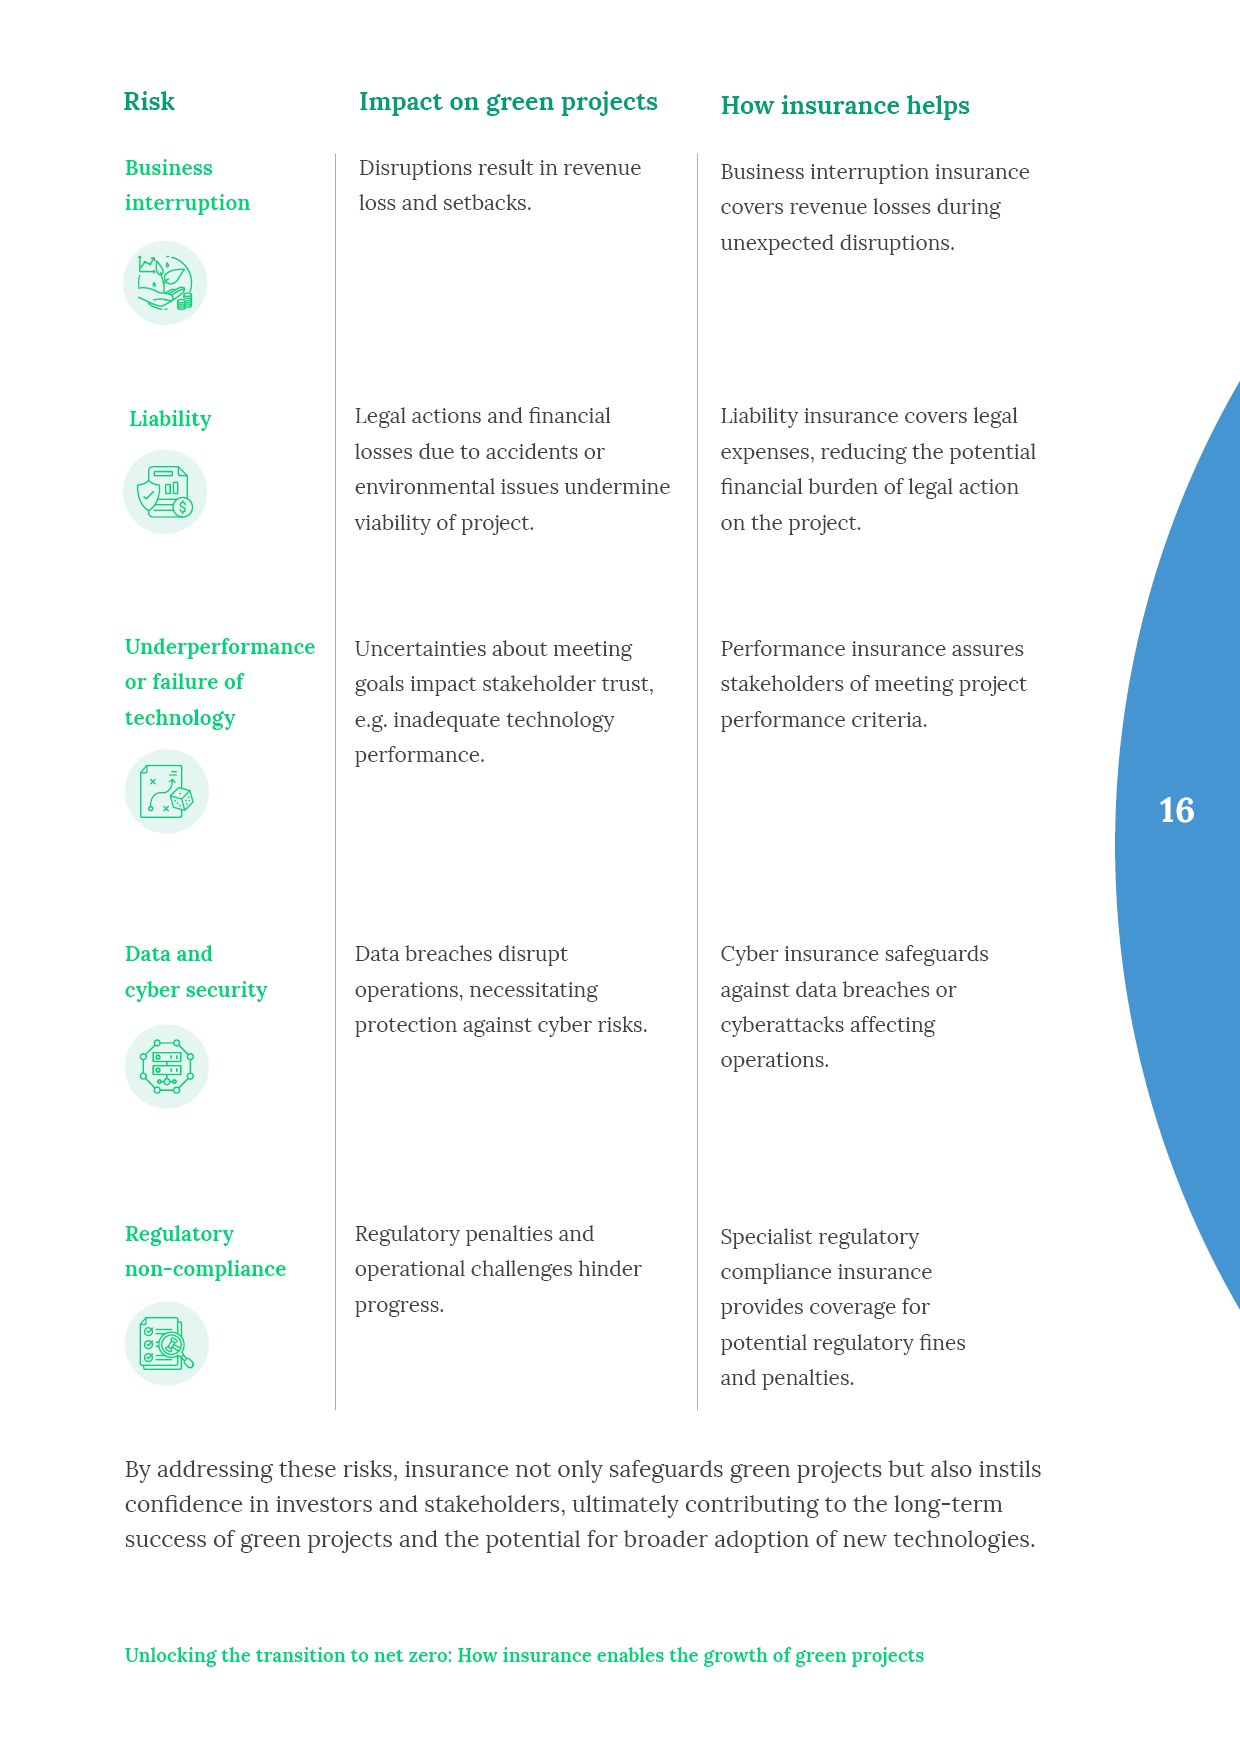
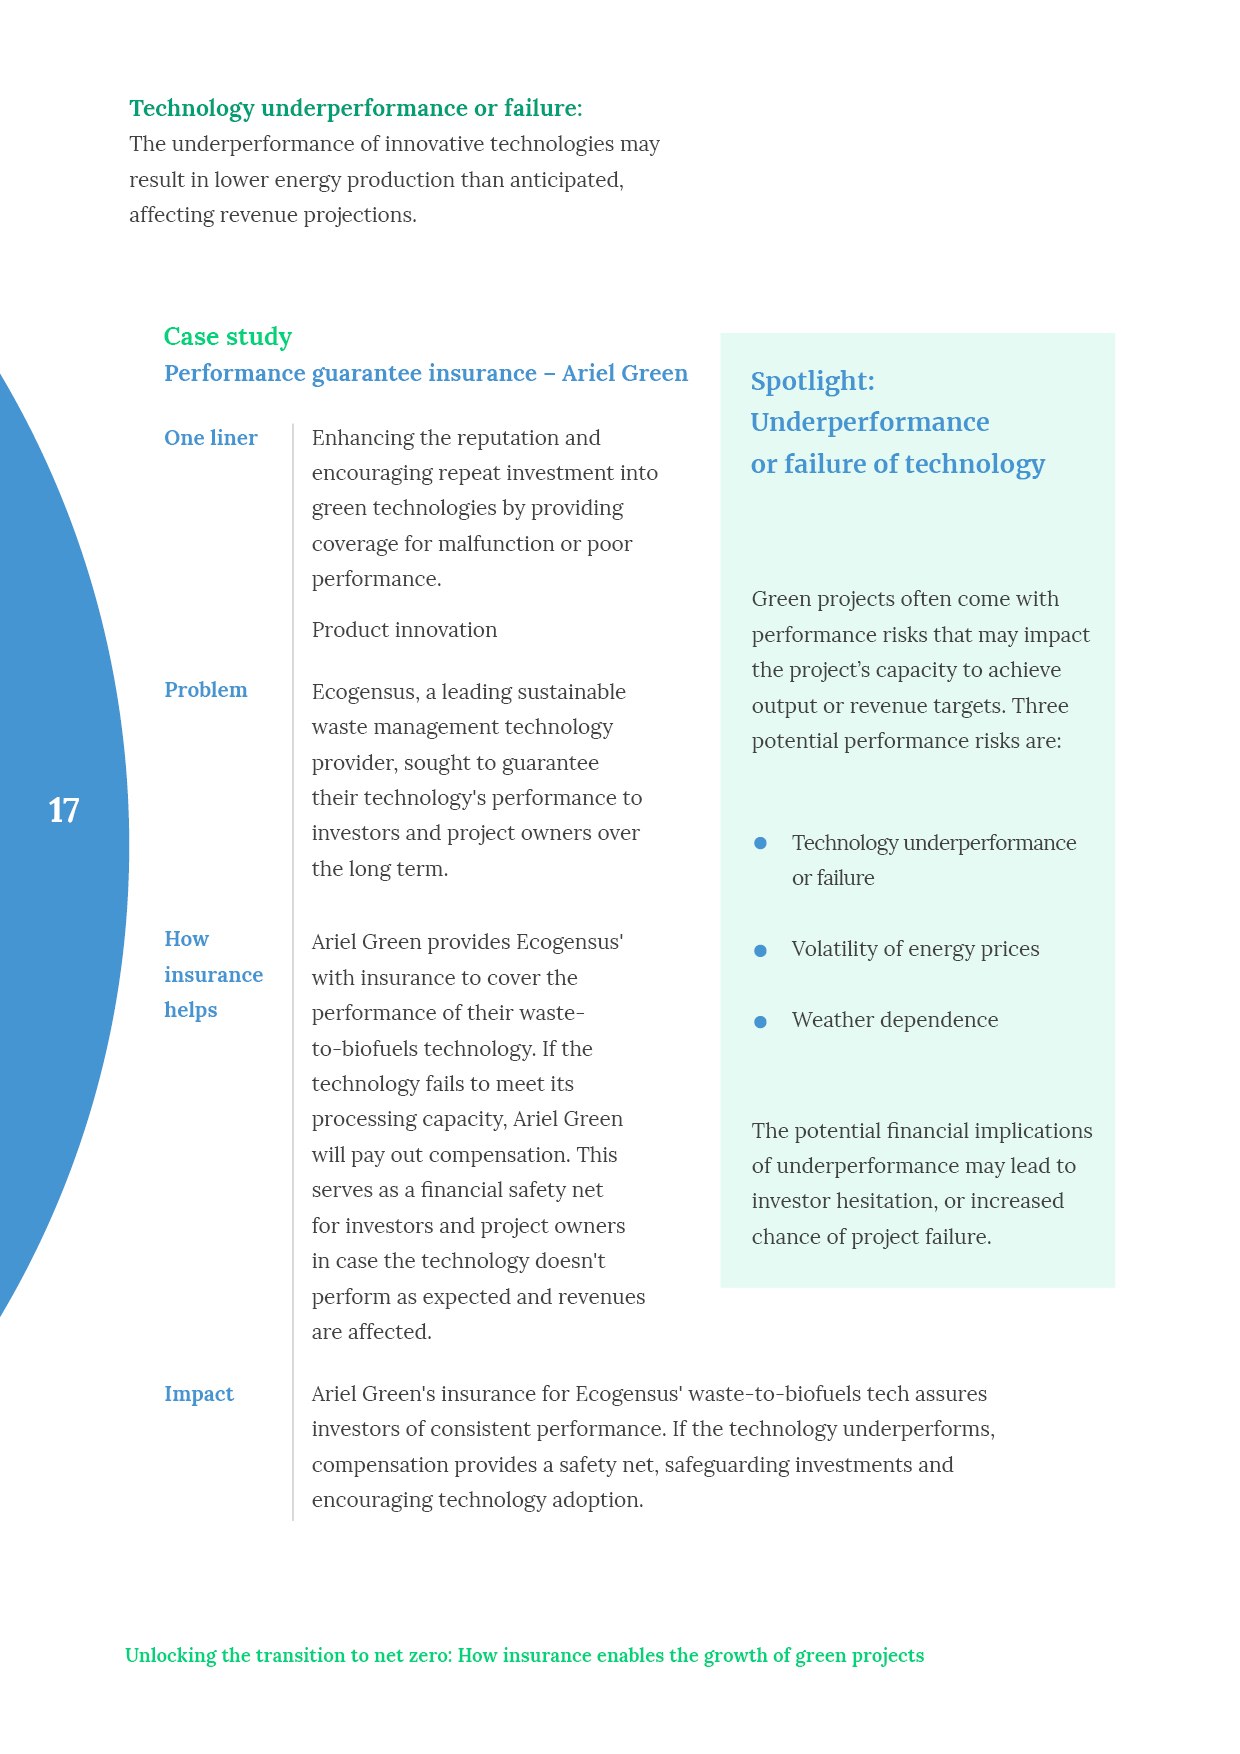
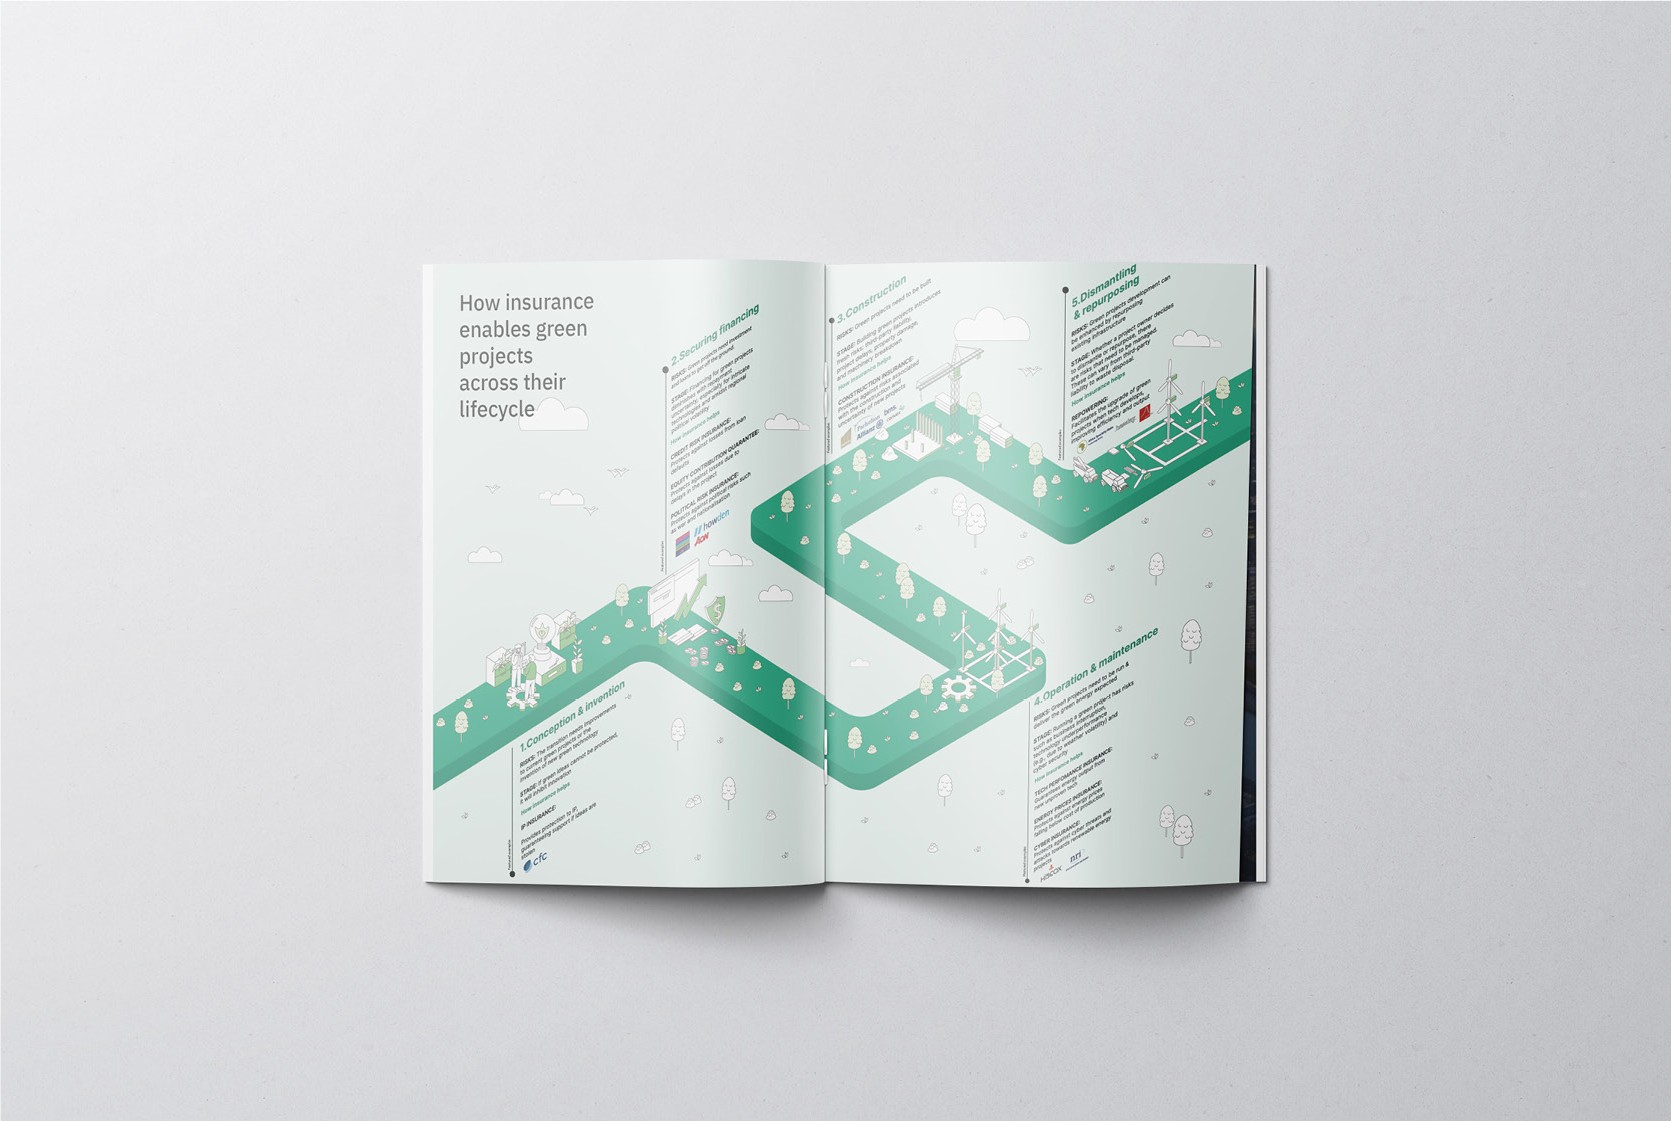
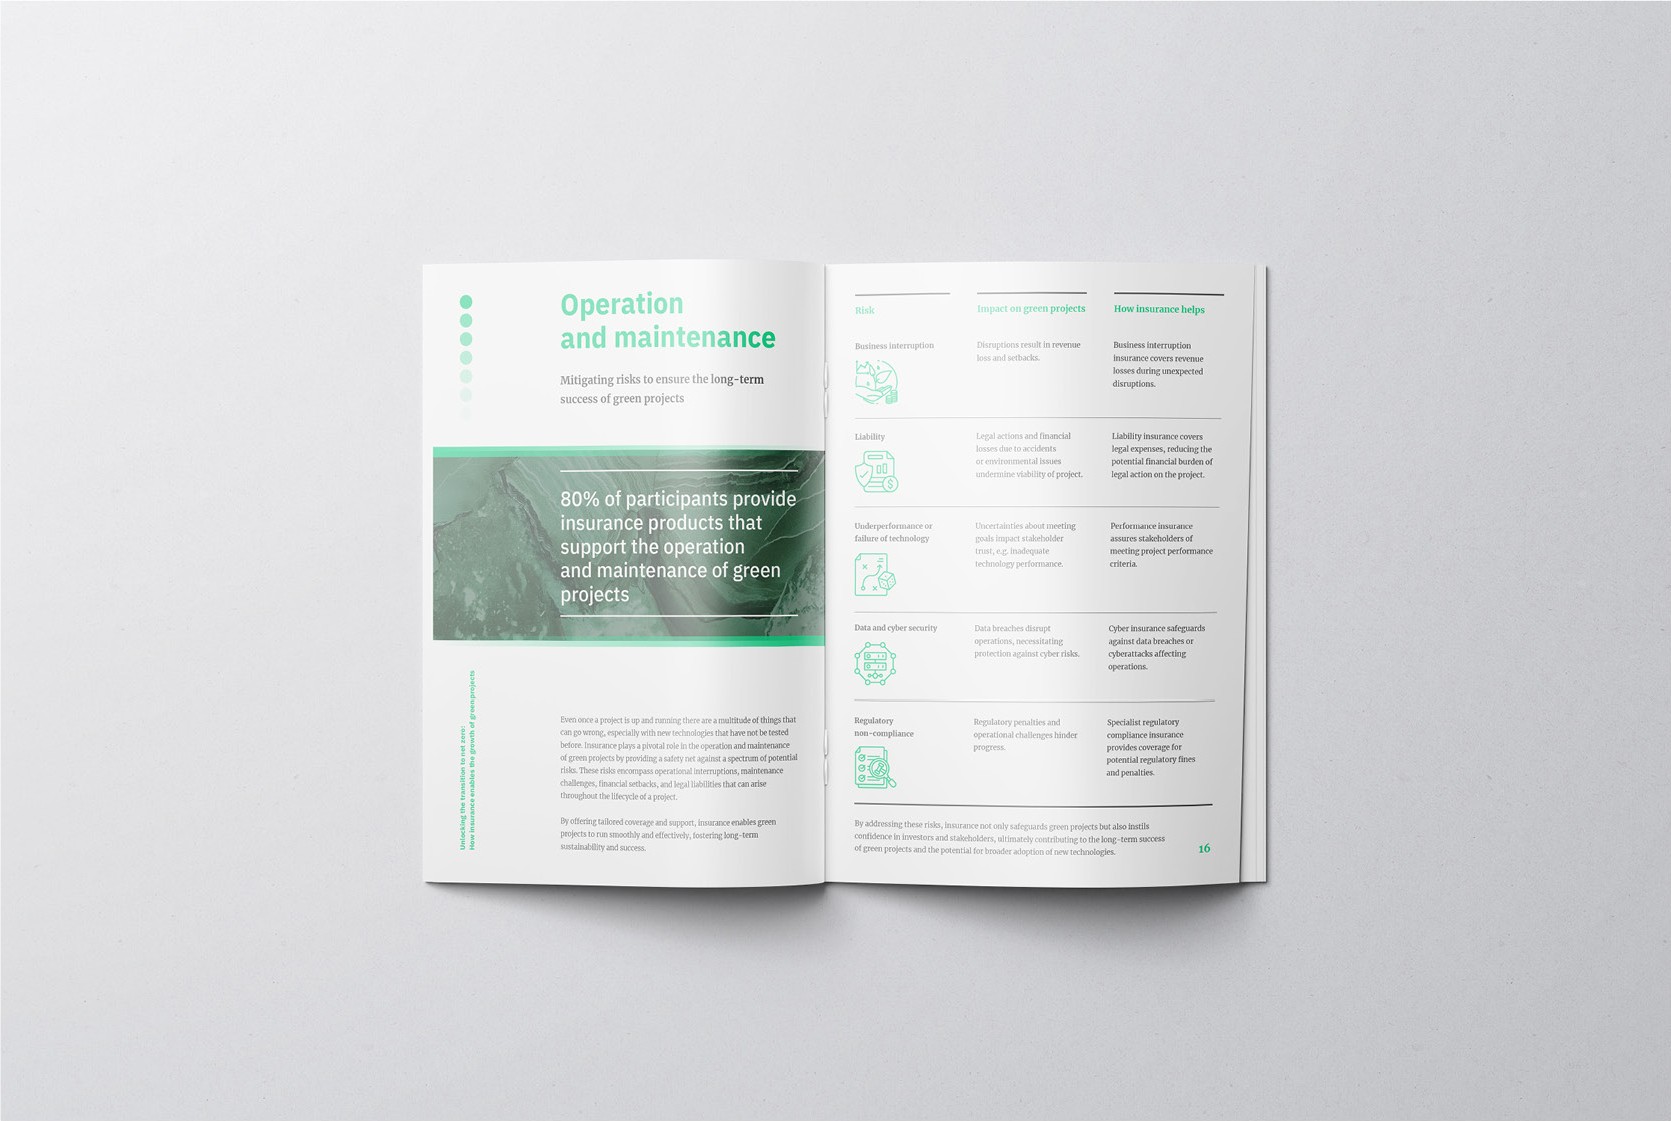
From there the same green system carried across the whole report: risk and impact tables, the parametric cover explainer and the operation spreads, all on one grid, in one voice.
The spreads
Page by page.
The same grid, palette and illustration language carry from the cover to the case studies and the insurer line-up at the back.
In print
The report, in the hand.
Printed and bound, the system holds as a physical object: the isometric lifecycle across the centre spread, the editorial tables, and the case studies through to the insurer line-up.
The outcome
A report people actually open.
A technical study turned into a piece OxBow Partners could put in front of the market with pride: one idea, one system, carried from the cover to the last spread.
Where does your brand sit against the business?
Every engagement starts with the Brand Alignment Diagnostic, a fixed first step that scores your brand against the business and shows what to fix first.